Slide decks made from your chapter, ready to present.
TeachSmartAI makes a class-ready slide deck from a chapter of your textbook. Pick the chapter and the number of slides. It writes the deck with speaker notes, uses the textbook’s own diagrams where they fit, and draws new pictures where the book has none. Present it from TeachSmartAI, or download it as PowerPoint.
- PowerPoint (.pptx) download with editable text
- Print or save as PDF for handouts
- Change or replace any slide’s picture without redoing the deck
- Speaker notes on every slide
- Present full-screen in class from the same screen
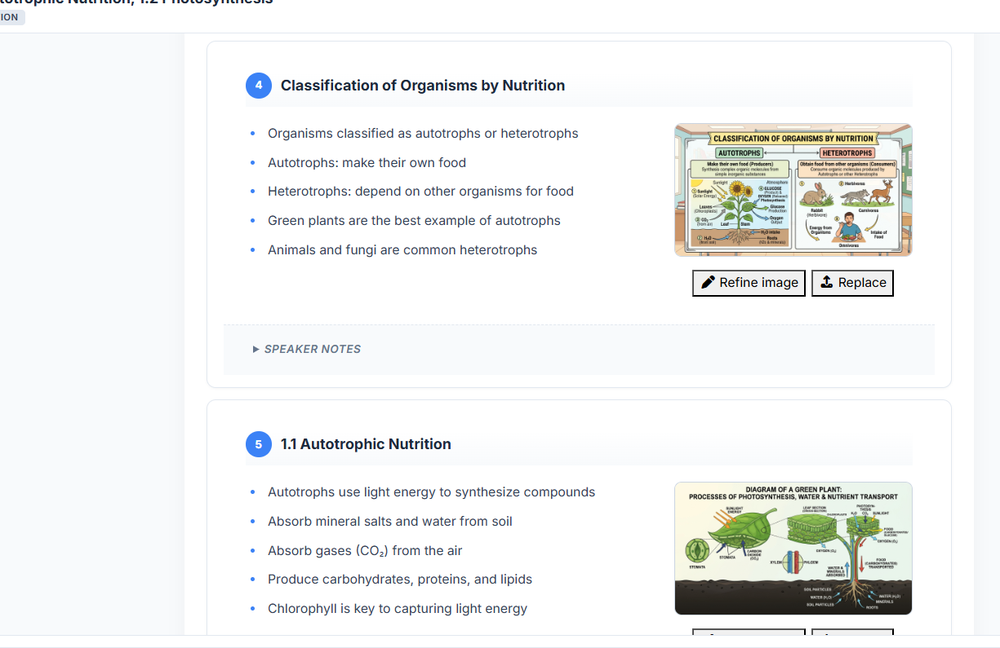
A five-minute visual summary, end of class.
Before the bell rings, a teacher needs one slide that pulls the chapter together. A Flow Chart is a visual recap: the main ideas in boxes, joined by arrows that show how they connect, in the chapter’s own language and script.
- One slide per chapter, fits any projector
- Shows cause → effect, problem → solution, process → outcome
- Uses the textbook’s diagrams where they exist, and draws new ones where they don’t
- Print it or save it as PDF
- Doubles as a revision handout
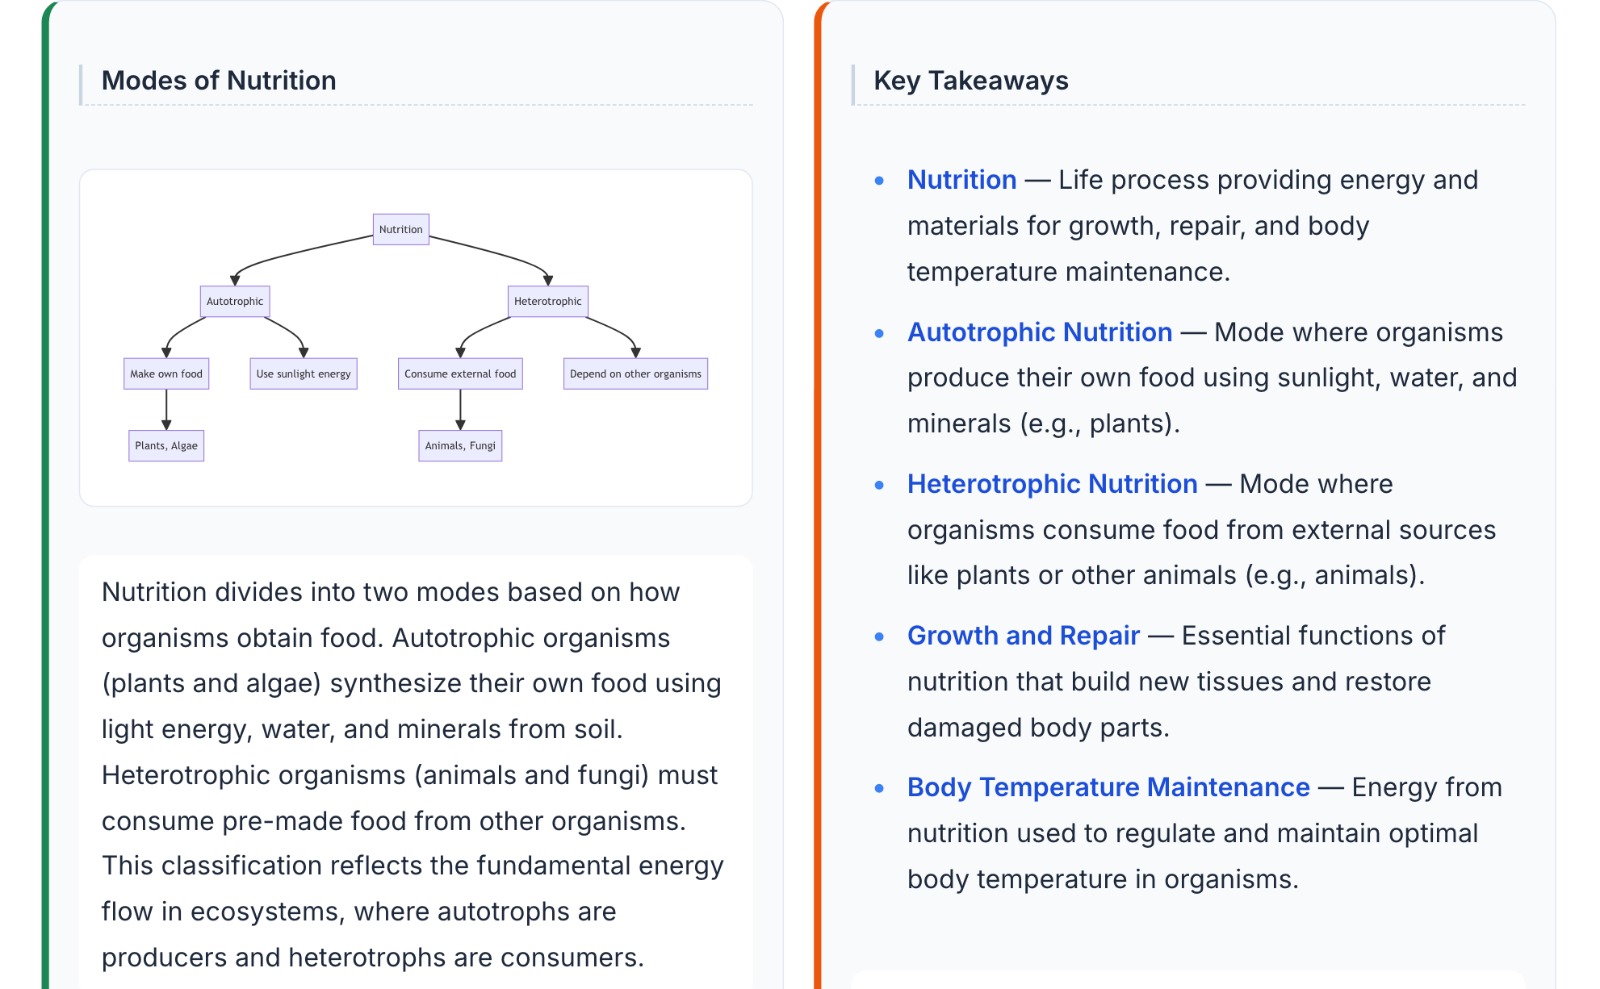
A working model the class can poke at.
Topics like photosynthesis, gravity, supply and demand or electric circuits are easier to grasp when students can change something and see what happens. TeachSmartAI makes a working model the teacher shows on screen and students try out in class.
- Sliders to change things like light, force, voltage or demand
- The picture changes instantly, with explanations on screen
- Opens in any web browser, with nothing to install
- Present it full-screen from TeachSmartAI on the classroom screen
- Built from the chapter’s own concepts and values
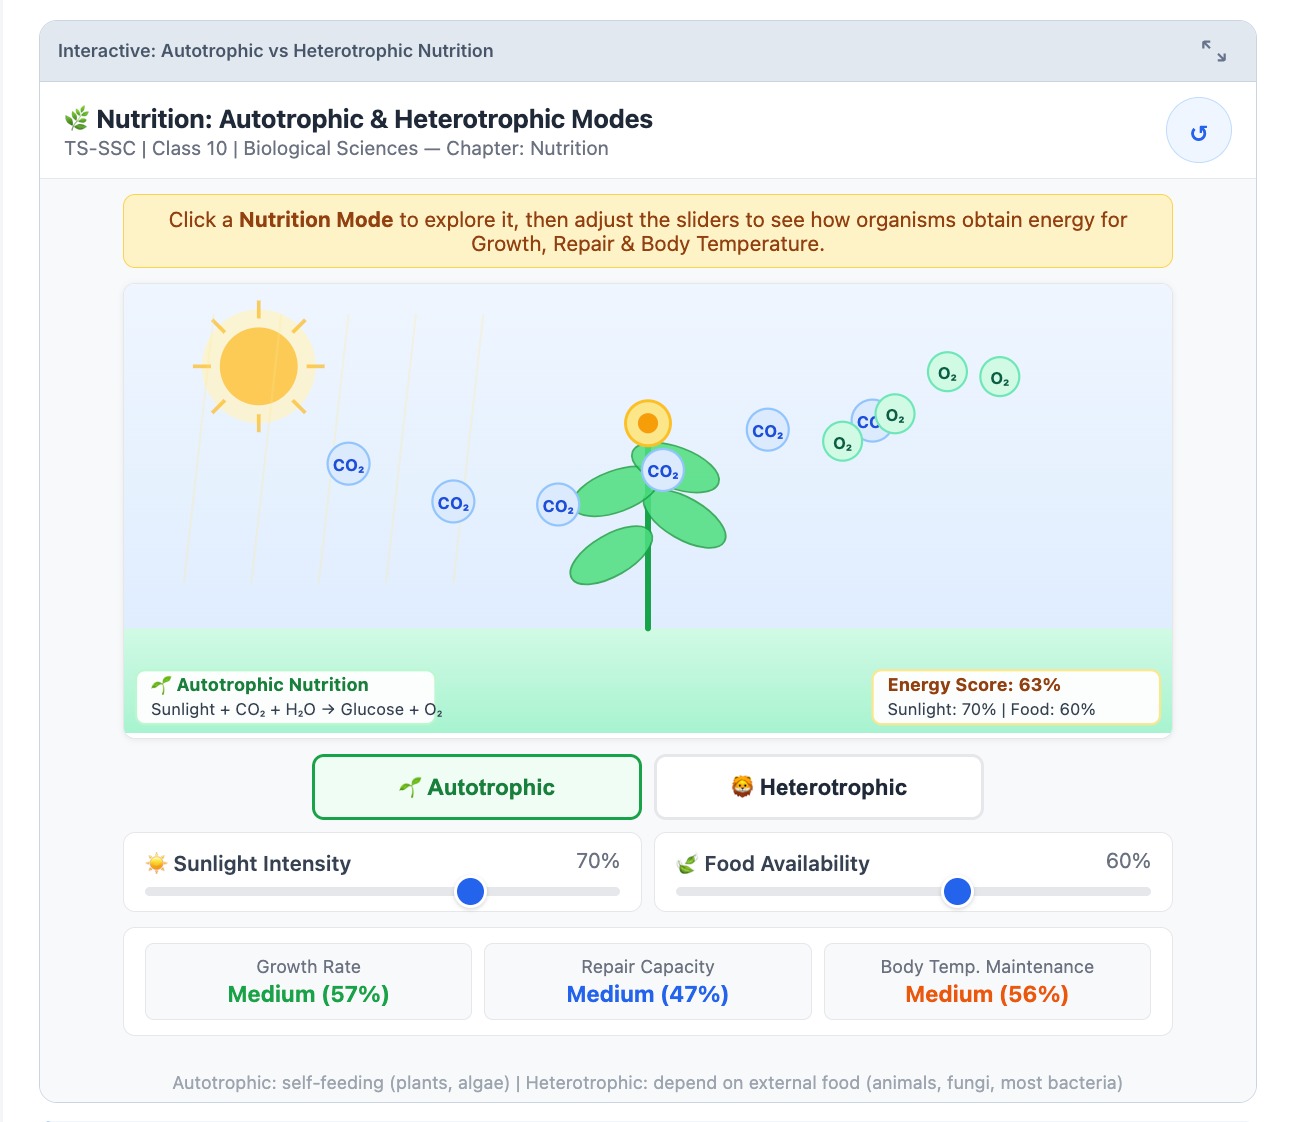
When the textbook diagram isn't there, or isn't enough.
Textbooks have good diagrams, but not for everything. For each chapter, TeachSmartAI draws extra diagrams for the main ideas. No clip-art and no stock images.
- Diagrams for the chapter’s main ideas, each with a caption
- Reused in slide decks and flow charts
- Change a picture by asking in plain English, try again, or use your own
- The book’s own figures come first; new ones fill the gaps
- Download any picture for print or projection
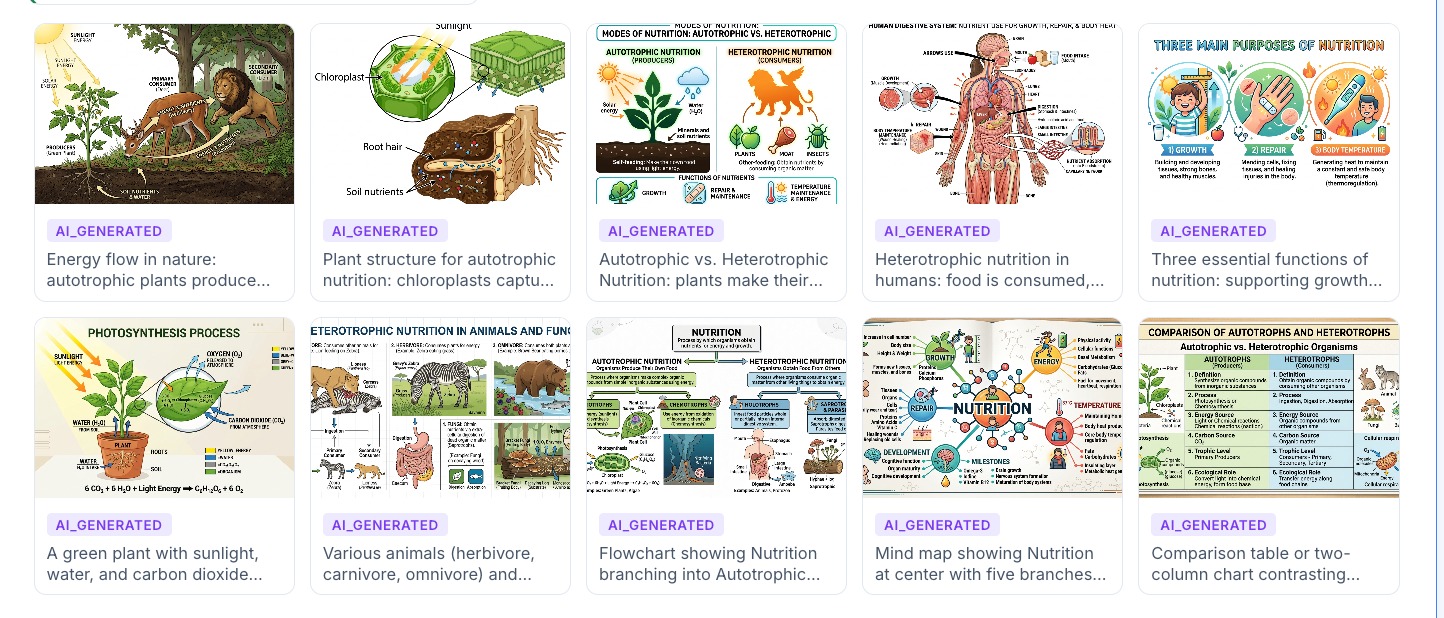
One chapter, four ways to see it.
Beyond the deck, TeachSmartAI turns the same chapter into revision material students will actually use, all from the book and in its own language.
The whole topic on one page
The chapter’s ideas branching out from one central topic, for quick revision.
A colour-coded concept board
Sections, key ideas and formulas laid out as one page, with a short quick-recap.
Two-sided recall cards
A term or question on the front, a short answer on the back. Use them in class or download them.
Notes students can study from
Short revision notes with practice questions, plus a glossary and competency-based questions for CBSE schools.
Other TeachSmartAI capabilities.
Slide deck questions teachers ask first.
Can I edit the slides after they are made?
Which formats can I download slides and revision material in?
Send a chapter. Get a class-ready slide deck back.
Free, with no commitment. We will make a deck from your chapter with you, live.