Home
Products ๐Ÿค–
Skora AI AI Grading
โœจ
Teach Smart AI Co-teacher on your books
๐ŸŽ“
Education ERP School & college platform
๐Ÿ‘ฅ
HRMS & Payroll People ยท payroll ยท compliance
Partners Pricing Blog Demo Contact
Talk to sales Book a demo
Sub-feature ยท Reports & Analytics

Marks are the start. Recommendations are the point.

Every graded paper produces a per-student report โ€” strengths, weak areas, page-by-page feedback, and specific learning recommendations linked to chapter sections in your textbook.

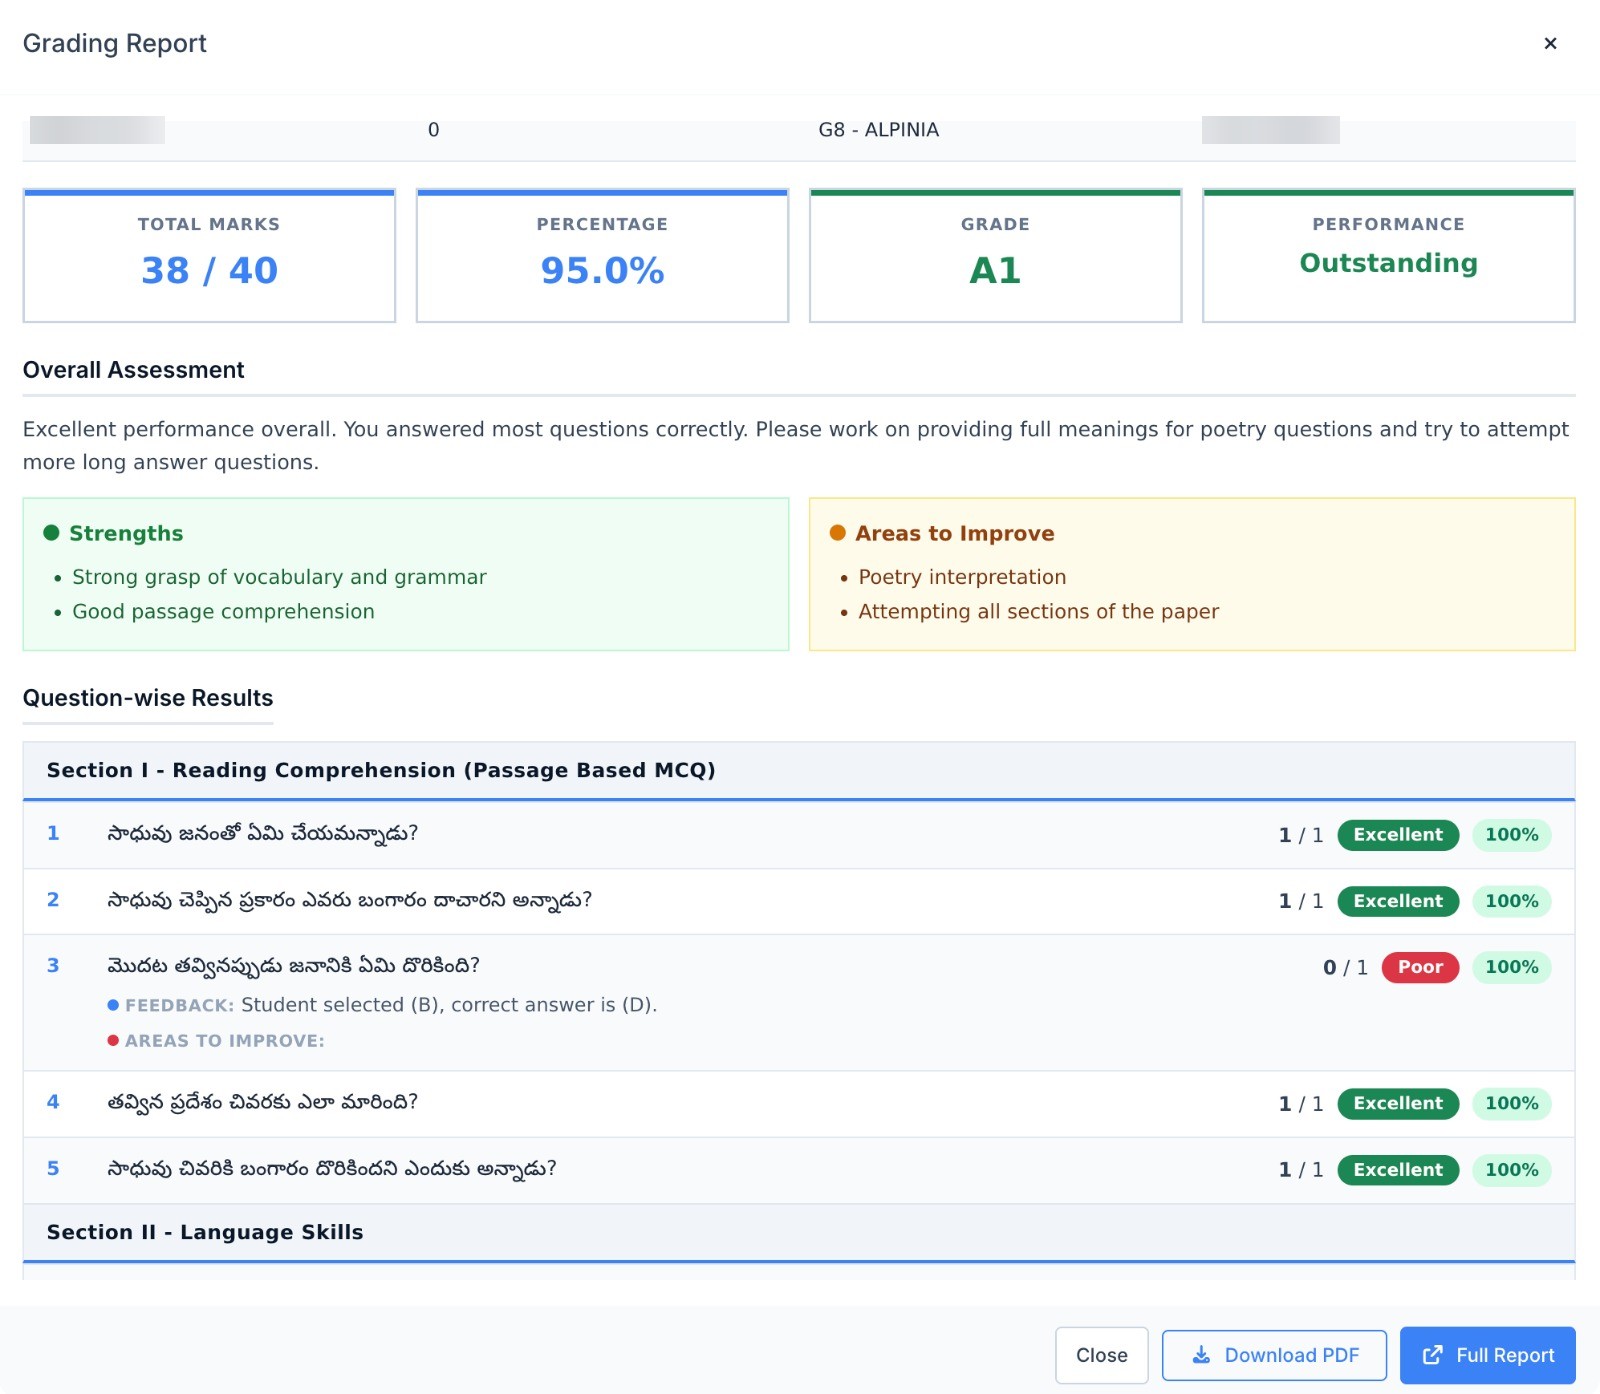
Per-student report showing marks, weak areas, and recommended chapters
Per-student report

A report a parent can actually use.

Not just a percentage and a grade โ€” a teacher-grade narrative on what the student got right, where they fell short, and what to revise.

  • Per-question marks with AI feedback for the student (not for the teacher)
  • Strengths summary โ€” chapters / skills the student handled well
  • Weak-area summary with specific topics, not generic categories
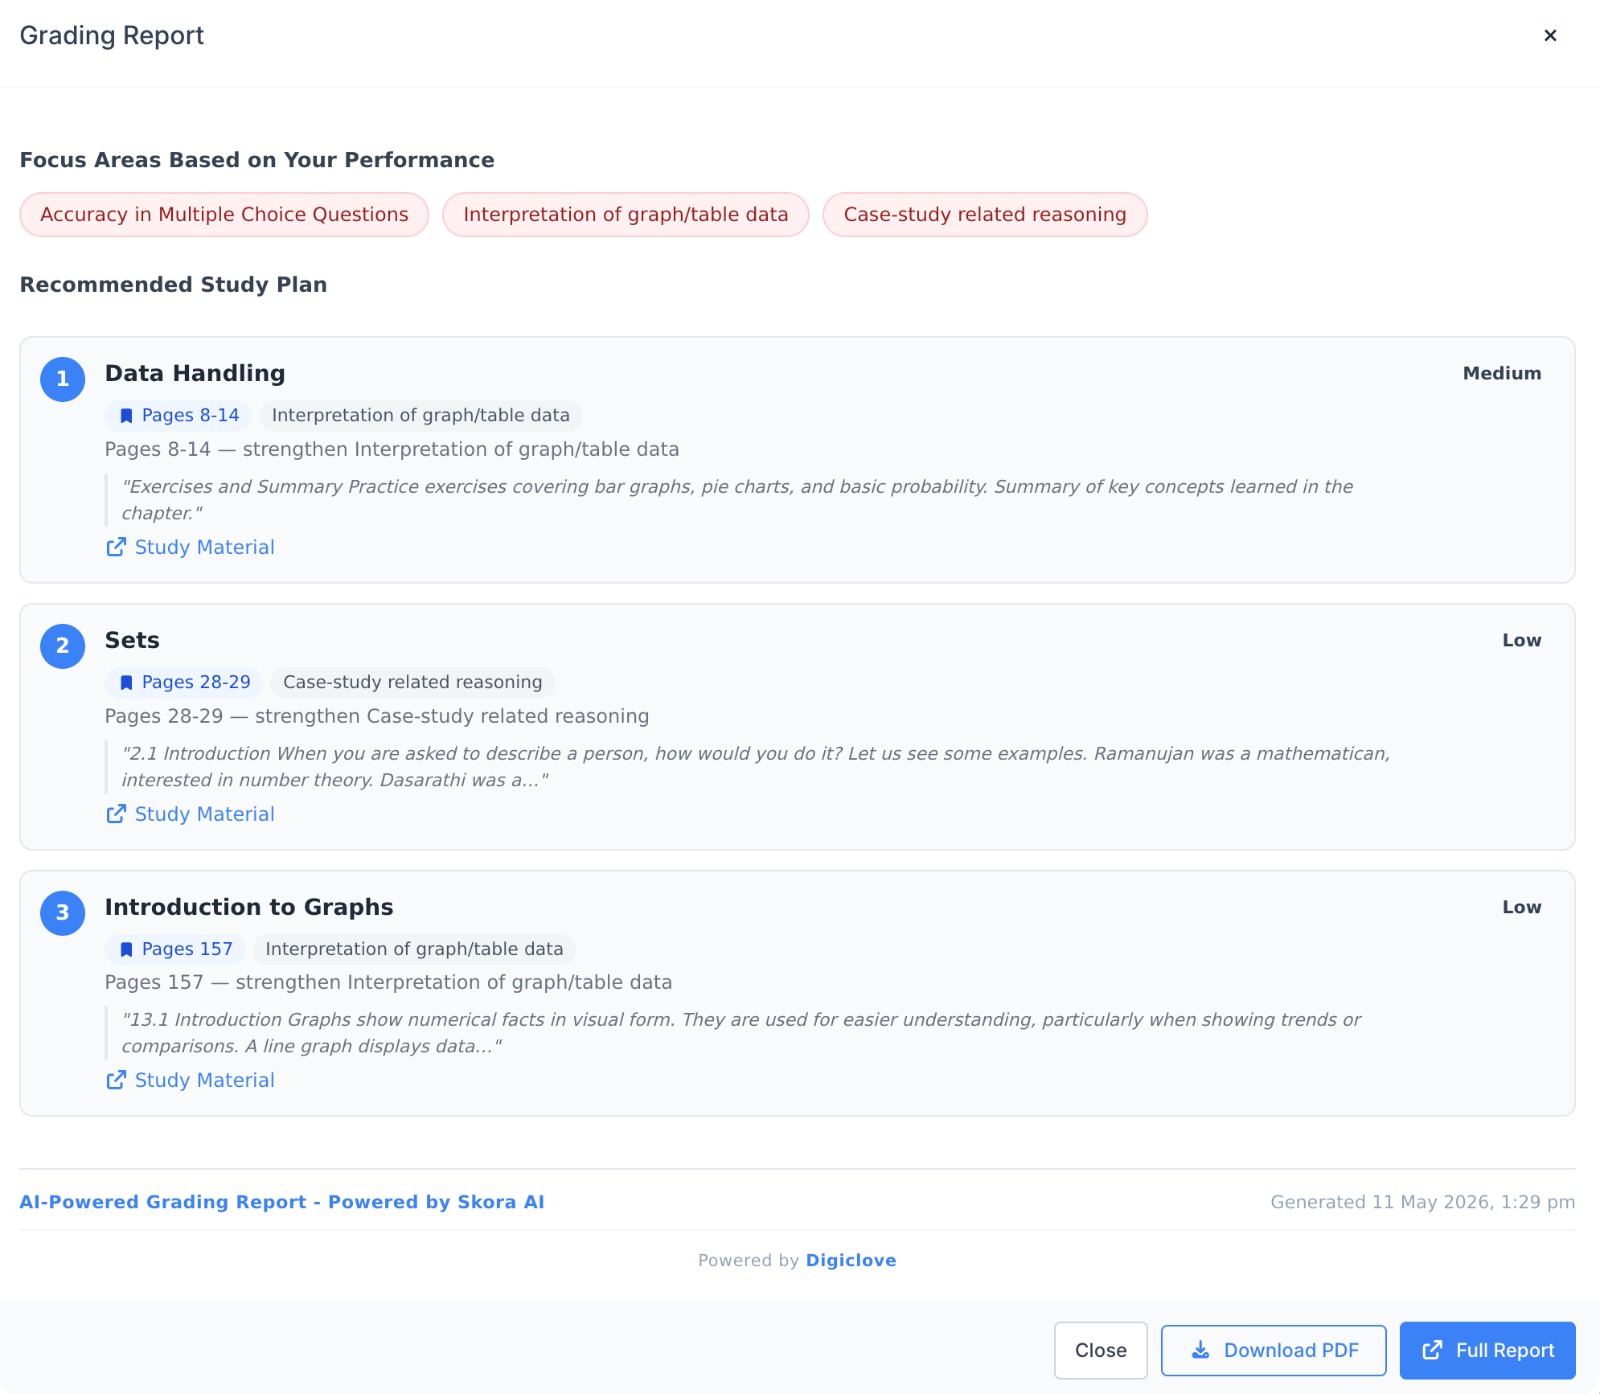
  • Recommended Teach Smart content โ€” chapter sections, page ranges, formulas, diagrams
  • Published to parent app + student app + printable PDF
Per-student report card showing total score, per-question marks, strengths and weak-area summary
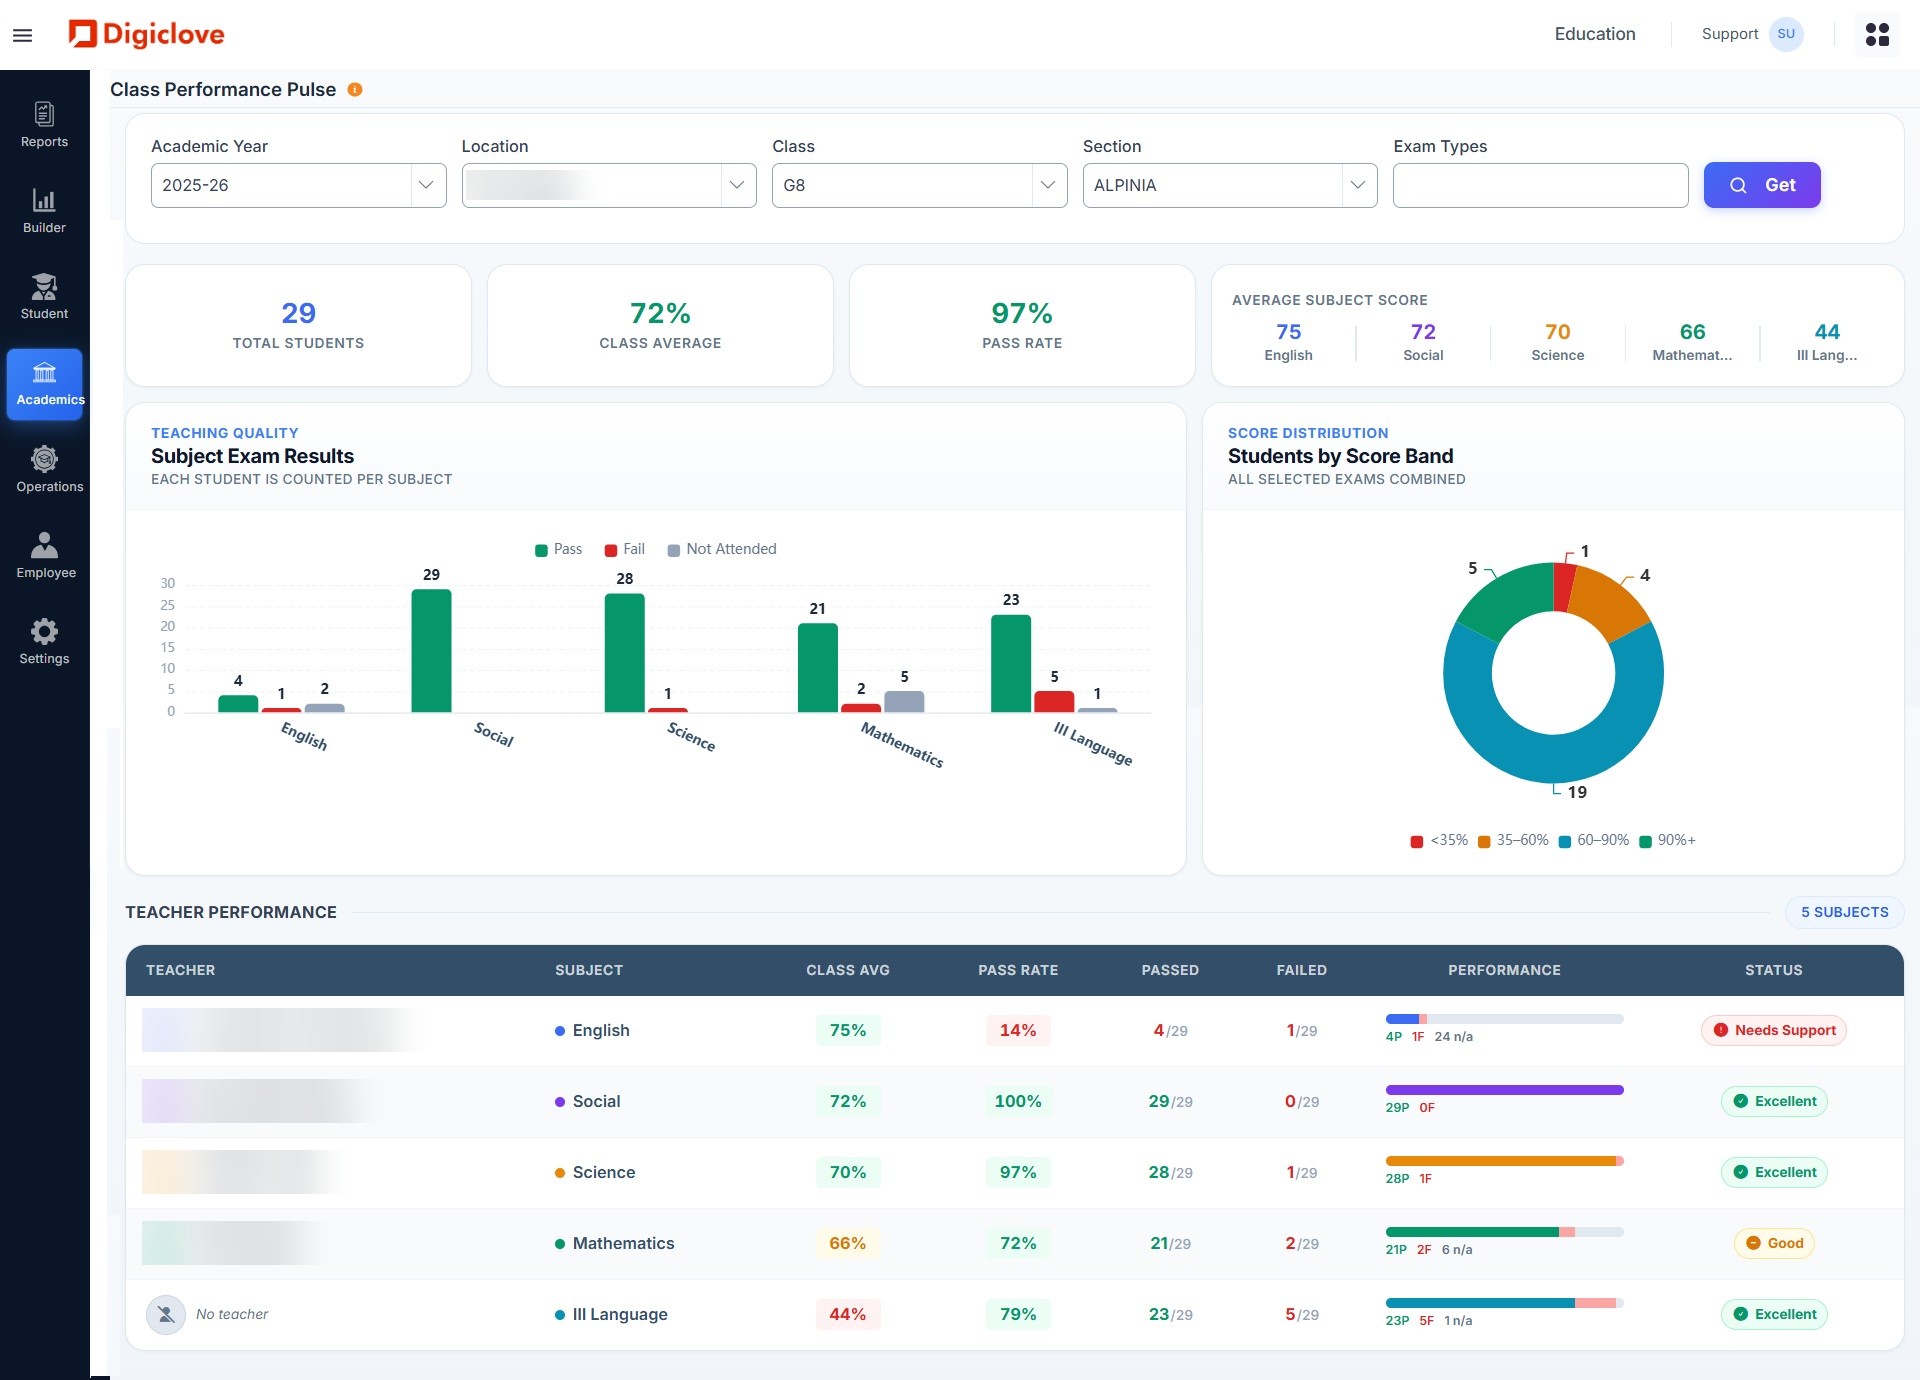
Class ยท Cohort ยท Cross-paper

Class-level analytics that drive next-week's lesson plan.

Aggregate the per-student reports and you get the picture every department head wants โ€” which chapters are this class' weak spots, who's pulling away, who's slipping, and how to plan re-teaching.

  • Class weak-area heatmap โ€” chapters ร— students with mark intensity
  • Performance trend per student across papers within the term
  • Cohort comparison across sections / branches / years
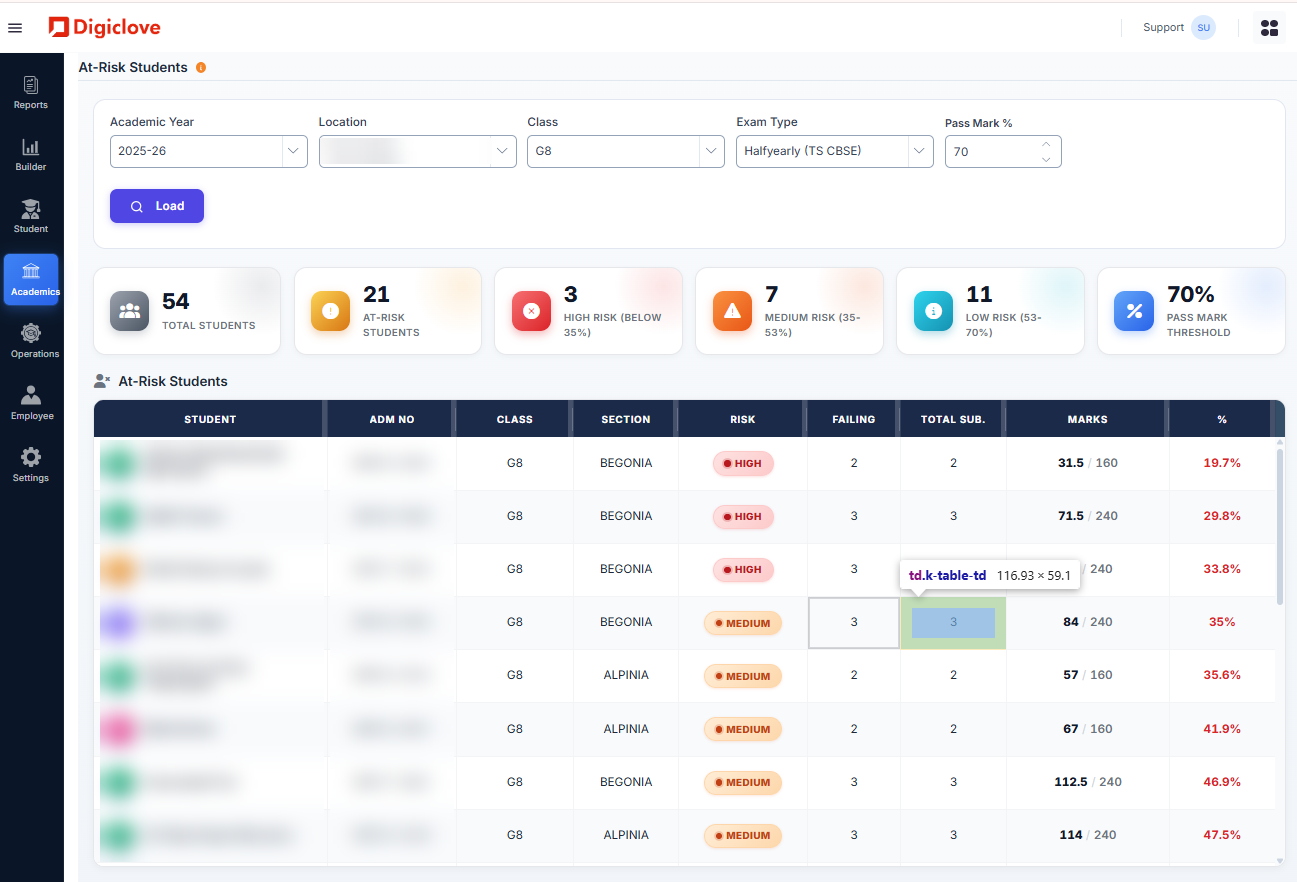
  • Anomaly flagging โ€” students with sudden drop or unusual answer patterns
  • Export to Excel, PDF, or pin as a saved dashboard view
Class weak-area heatmap showing chapters versus students grid with mastery levels colour-coded
Closed loop with Teach Smart

Weak areas become next week's worksheet.

When Skora AI and Teach Smart AI run together, every weak area found in grading becomes a candidate for a re-teach worksheet, lesson plan, or AI tutor chat session โ€” generated from the same indexed textbook.

  • One-click "Generate revision worksheet" from a weak-area report
  • Auto-suggest Teach Smart lesson plan for under-performing chapters
  • Textbook Chat answers reference the same chunks used in recommendations
  • Track effectiveness โ€” did the next paper show improvement on those topics?
Learning recommendation card showing weak-area diagnosis, chapter citation, and Generate revision worksheet action
Frequently asked

Reports questions teachers and parents ask first.

What does the student see versus what the teacher sees?
Students and parents see the per-question marks, feedback written in student-facing language, the strengths and weak-area summary, and the recommended chapter sections to revise. Teachers and admins see the same plus the per-question AI reasoning (the AIReasonPoints audit trail showing matched and missed keypoints), the original AI verdict where overrides happened, the prompt version used, and confidence scores. Student-facing feedback is never seeded with internal language.
How specific are the weak-area recommendations?
Specific to the section, not to the chapter. "Coordinate Geometry ยง3.4 โ€” distance formula" rather than "revise Coordinate Geometry". Recommendations are derived from the answer-key chunks that the student missed during grading, so the cited section is the exact spot in the indexed textbook that the question was drawn from. The same chunks power any follow-up Textbook Chat the student opens from the report.
How do reports get to parents โ€” do they have to log in somewhere new?
For schools running the Digiclove Education ERP, reports publish to the existing parent app and student app the moment the teacher approves them, with a push notification. They're also available as a printable PDF if the school prefers handouts during PTM. There's no separate Skora AI account for parents to remember.
What class-level analytics are available beyond per-student reports?
A chapter-by-student heatmap shows where the class as a whole is weak; per-student trend lines track performance across papers within a term; cohort comparison stacks sections, branches, or year-groups; and anomaly flagging highlights students with a sudden drop or unusual answer patterns. Department heads typically use the heatmap to decide what re-teach the following week, and the trend view at term-end to identify students for intervention.
Can a weak-area report directly trigger generation of a re-teach worksheet?
Yes โ€” for schools running both Skora AI and Teach Smart, every weak-area card has a "Generate revision worksheet" action that hands the underlying chapter and topic scope to the Teach Smart worksheet generator pre-configured for the right difficulty. The same closed loop applies to lesson plans and Textbook Chat sessions, so the next class can be tuned to exactly what the last paper revealed.

See what your students' reports would actually look like.

Send a paper you've already graded. We'll show you the AI report your parents would receive โ€” for free.

Send a paper Back to overview