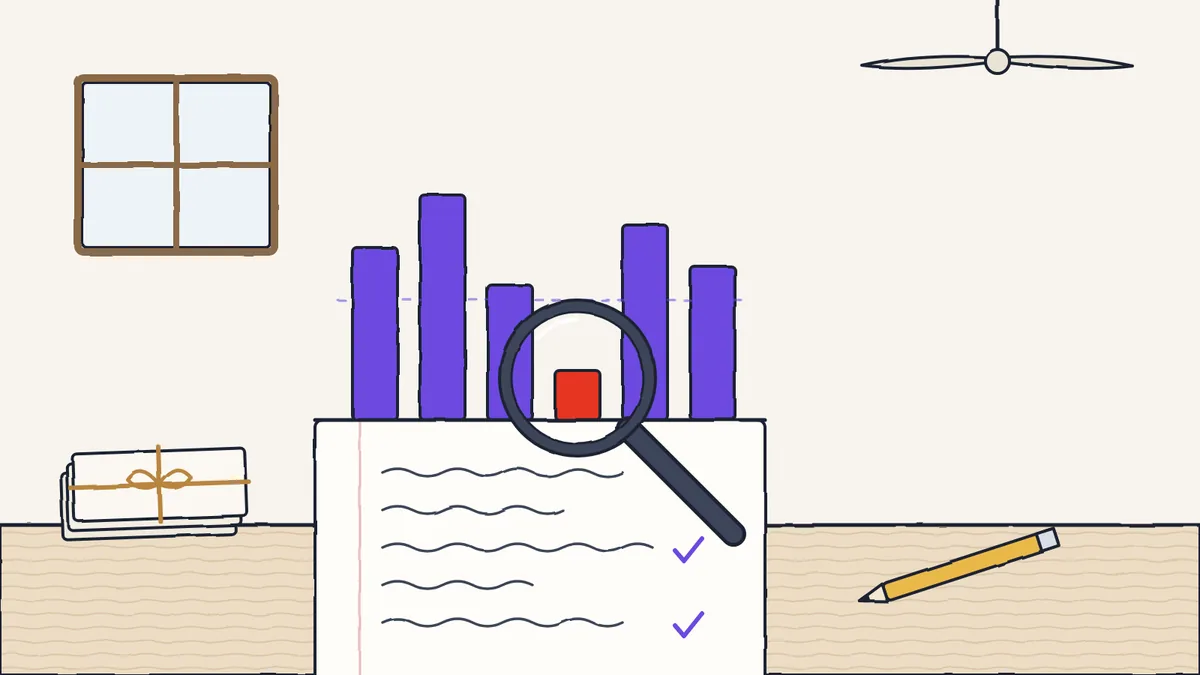
The most underrated benefit of marking every paper with SkoraAI is the information it leaves behind. Once every question on every paper has a clear record of marks given, points covered, points missed, and any teacher change, you have insight that an ordinary marks register cannot give you.
- Marked answer sheetsEvery question, with its reason
- Marks per questionFor every student
- Weak chaptersWhere the class lost marks
- Section comparisonThe same paper, section by section
- What to reteachThe teacher plans the next lesson
This post walks through the views principals open first, the ones they open in week two, and the one they only realise they wanted three months in.
The dashboards opened on day one
1. Section-by-section comparison
Plot the average score by question across sections of the same class. Two things jump out immediately: which sections did better on which topics, and — more uncomfortably — which questions had wildly different scores depending on which teacher the section had.
Many schools see the gap between sections in one chart for the first time. It is not for pointing fingers. It helps the HOD see which questions to discuss again at the next subject meeting.
2. Weak areas in detail
For every concept the paper tested, you see the % of students who got it right, partially right, or missed it. Clicking a concept opens the actual student answers, with names hidden and grouped by marks, so the teacher can read what the wrong answers looked like.
This is the view that changes Monday-morning teaching. "60% of class 9 missed question 7" is one thing. Seeing the wrong answers is what tells the teacher how to reteach it.
3. Question difficulty
Before SkoraAI, "this paper was harder than last term" was a teacher's intuition. With results for every question, it becomes a number: how hard each question was for the class. If a question scores very differently from what the teacher expected, either the teaching or the question needs a second look. Both are useful to know before the next paper is set.
The dashboards opened in week two
4. Teacher vs SkoraAI
Where did SkoraAI's mark and the teacher's change differ, and by how much? Across a term, this shows a pattern. If teachers keep changing marks the same way on one type of question, the answer key, or how SkoraAI marks that type, needs a fix. SkoraAI's reliability report puts this in one place: how closely its marks agree with teachers' marks, and where they differ.
Teacher changes are not just a measure of the AI being wrong. They show the school where its answer keys need to say more clearly what teachers mean.
5. Per-student trajectory
For every student, a timeline shows scores across every test in the term. A student slipping in one subject is a different conversation from a student dropping across the board.
The conversation in the parent meeting changes from "she got 68%" to "her scores in this subject have dropped across the last three tests — here's what we'll do."
6. Teacher review load
How many papers were waiting for review this week? How long did they wait? Which teachers are up to date and which are falling behind? This view helps the principal stop "we're behind on results" from being a surprise.
The dashboard you'll want three months in
7. Concept-level mastery across the year
Once you have three terms of results, you can finally answer the question every curriculum head wants to answer: did the cohort actually learn this concept, or did they just pass the test on it once?
The same concept, tested in different forms across the year, plotted as a band: green means mastery is sticky, amber means it's there but fragile, red means students are passing on memorisation and forgetting. This view shapes next year's syllabus and pacing, not just next month's lessons.
The view across schools
For groups running several schools, such as chains, franchises and district academic offices, the same results add up across schools. Schools can be compared on the same paper. You can see which school gets strong results on which topics, so good practice can be shared rather than reinvented.
None of this is unusual AI. It comes naturally from marking every paper the same careful way and keeping the reasons for every mark. The reports are not the product. They are what you get from marking carefully.
What's new (October 2026)
- SkoraAI reports. Weak chapters for each section, section-by-section comparisons and the AI-vs-teacher reliability report.
- One place to find them. They sit among more than 500 reports and dashboards, and the Reports Hub finds any report by its name.
Send us a term-end paper. We will mark it free.
No commitment. We mark it with SkoraAI and email you the marked sheet, with the reason for every mark, the weak areas, and our price for a pilot. Your teacher checks every mark alongside ours.